Power BI portfolio build · independent public data
Federal Contracting Performance
A decision-focused model built to compare obligated dollars, competition, small-business participation, and agency goal attainment across FY2023–FY2025.
KEY FINDINGS
What the evidence tells us.
Independent public-data portfolio model · FY2023–FY2025. Findings refer to the published, validated model, not a current federal spending estimate.
FY2025 leads the modeled period
Modeled obligations were $746.4B in FY2023, $740.9B in FY2024 and $778.4B in FY2025.
Decision to inform
Validated fiscal-year totals Investigate agency contributions to the increase. Obligations represent commitments, not cash outlays.
Competition needs agency context
Competed obligations represent 68.2% of the modeled base; sole-source obligations represent 31.8%.
Decision to inform
Published dashboard snapshot Compare competition within agency and award context before drawing procurement-policy conclusions.
Participation is not goal attainment
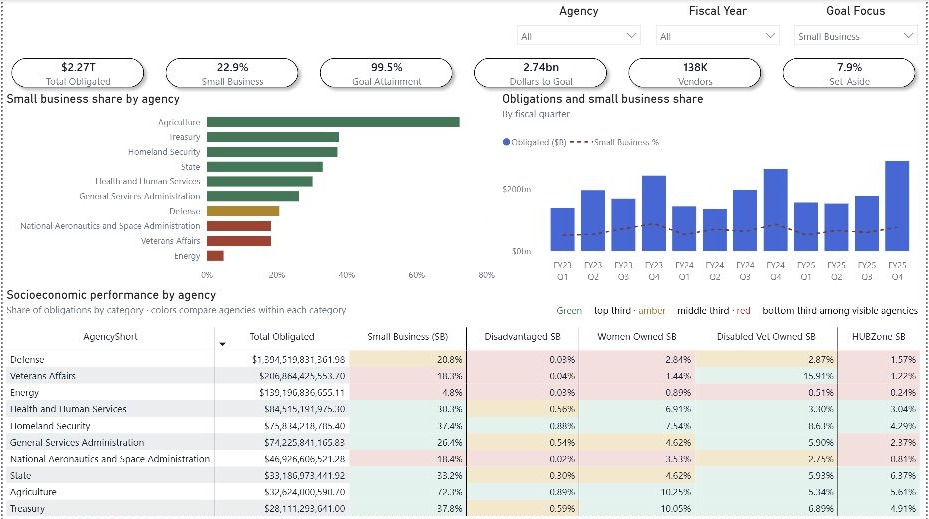
Small businesses account for 22.9% of total modeled obligations. SBA attainment uses eligible dollars and matching agency, year and category goals.
Decision to inform
Measure definitions and limitations Use the correctly scoped goal measure to assess attainment; these different denominators cannot be compared directly.
The question
Turn a very large award dataset into an answer leaders can use.
Federal-award records are detailed enough to support many valid analyses, but that detail can make a report slow, inconsistent, or hard to interpret. The project therefore started with a small set of decision questions and built the model around them.
- How much was obligated in each fiscal year, and where did the total change?
- What share of obligations was competed versus awarded through sole-source paths?
- How much obligated value went to small businesses?
- Which agencies were above, near, or below the goal associated with their agency, fiscal year, and category?
The model
Keep the detail needed for analysis without letting the fact table control the report.
The central award fact table contains approximately 19.2 million rows. A rewrite reduced it to roughly 297 MB by removing an unnecessary transaction key and using compressed storage, while validation confirmed that the obligation totals did not change.
Fact_Awards
The large obligation-level fact table used for fiscal-year, competition, agency, and small-business analysis.
Dim_Goal
A 360-row goal table covering 120 agency-year combinations. It remains disconnected so the correct target can be retrieved by agency, fiscal year, and category rather than creating an ambiguous relationship.
Measures
DAX measures calculate obligations, competed and sole-source shares, small-business participation, and the goal applicable to the selected agency context.
The report
Make the main performance signals visible before asking the user to explore.
The report leads with the complete obligation base and the core participation and competition measures. Agency views then add the correct goal context instead of repeating a single 23% line for every agency and year.
Validated results
Separate a useful insight from a number that merely looks precise.
| Fiscal year | Obligations |
|---|---|
| FY2023 | $746.4B |
| FY2024 | $740.9B |
| FY2025 | $778.4B |
- FY2025 was the largest of the three modeled years at $778.4B, compared with $746.4B in FY2023 and $740.9B in FY2024.
- 68.2% of obligations were competed; 31.8% were associated with sole-source awards.
- Small businesses represented 22.9% of modeled obligated dollars. That share is a portfolio KPI, not by itself proof that every agency met its goal.
- Agency attainment required goal data to be matched by agency, fiscal year, and category rather than applying one constant target across the report.
Quality control
Build reconciliation into the analysis, not into the final explanation after something breaks.
- Reconciled the total obligated amount and each fiscal-year total against the prior validated run.
- Confirmed competed and sole-source shares sum to the complete modeled obligation base.
- Kept the goal table separate and retrieved the correct target only for the matching agency, fiscal year, and category.
- Removed an unnecessary transaction key and used compressed storage to reduce the large fact table while preserving the validated totals.
Obligations are not the same as outlays, award records can be revised, and a portfolio-level small-business share should not be treated as universal agency attainment. Those limitations are part of the interpretation, not footnotes to ignore.
The dashboard percentages use total modeled obligations, while SBA scorecard attainment uses eligible dollars. Because those measures have different denominators, they provide related context but should not be compared as if they were the same KPI.
Why it matters
The deliverable is not only a dashboard. It is a defensible path from source data to decision.
This project demonstrates the work required before a polished visual is credible: modeling a large fact table, defining KPIs, resolving goal context, checking totals, labeling limitations, and presenting the result so a nontechnical reviewer can act on it.
It is an independent portfolio build using public data. It is not presented as Confia Solutions, LLC client work, and no confidential employer or client data is included.
APPLY THIS TO YOUR TEAM
Need a reporting model your team can trust?
Discuss source consolidation, KPI definitions and validation before the final dashboard.