PORTFOLIO · OPEN TO REMOTE ANALYTICS ROLES

Understand performance.
Explain the change.

I’m David Edmonds, a Data Analytics Consultant with Confia Solutions, LLC. My work covers operational reporting, dashboard development and performance analysis: defining the measures, checking the data and explaining what the results mean.

David Edmonds, Senior Data Analyst and BI Professional
10+years across public & private sectors
100+analytical and reporting products delivered
SELECTED WORK

The question, the analysis,
and the evidence.

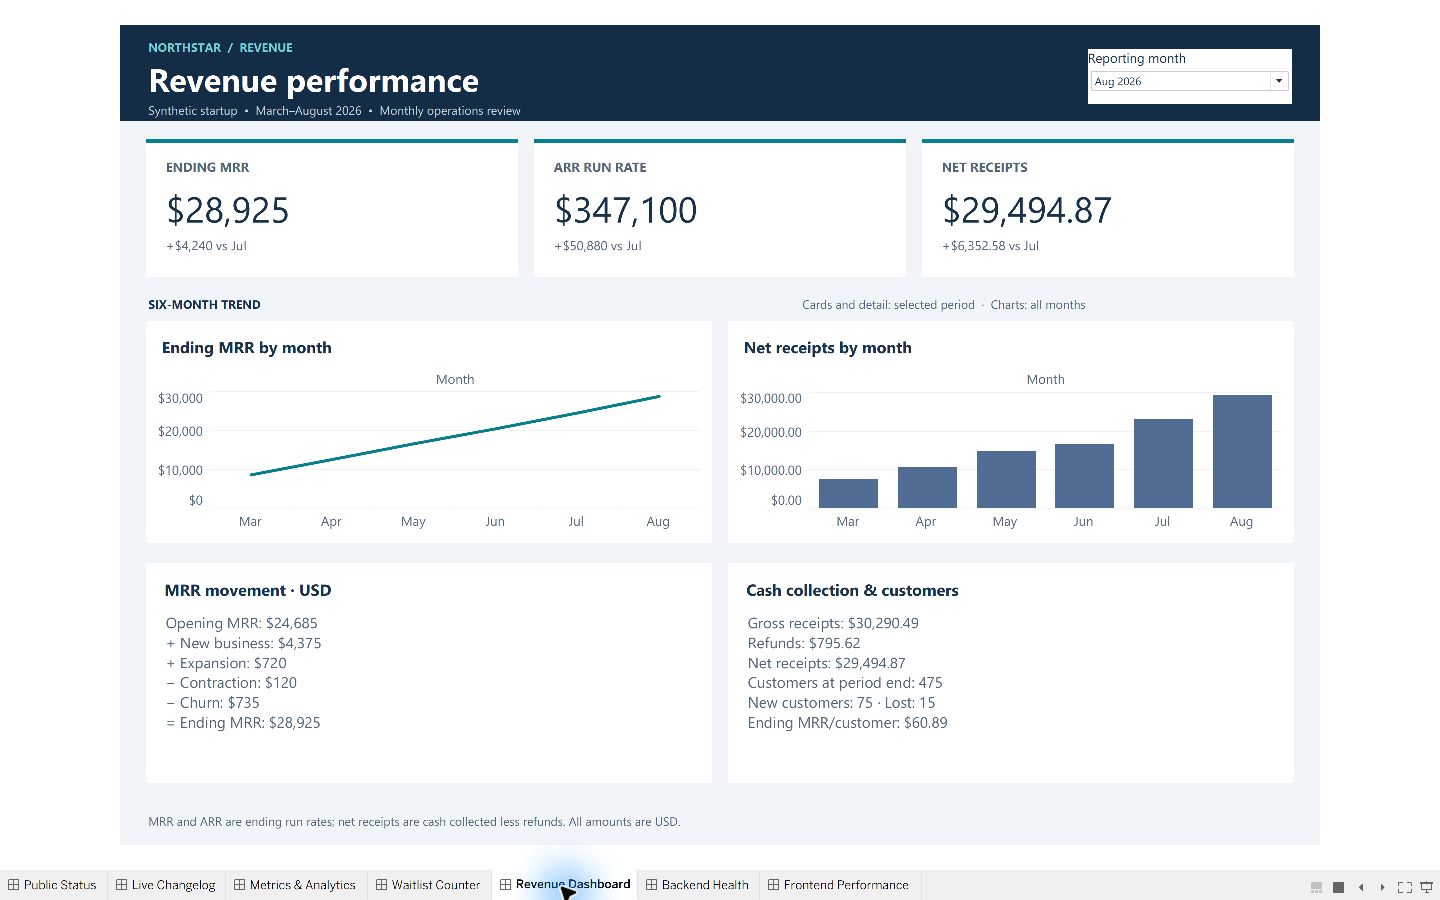
Tableau recurring revenue review using synthetic startup data
TABLEAU · SYNTHETIC DATA

Startup Operations Dashboards

The question
What changed this month, and what explains it?
The approach
Connect operational KPIs to trends, incident detail and reconciled balance movements.
Explore
Seven dashboard previews and an editable Tableau workbook.
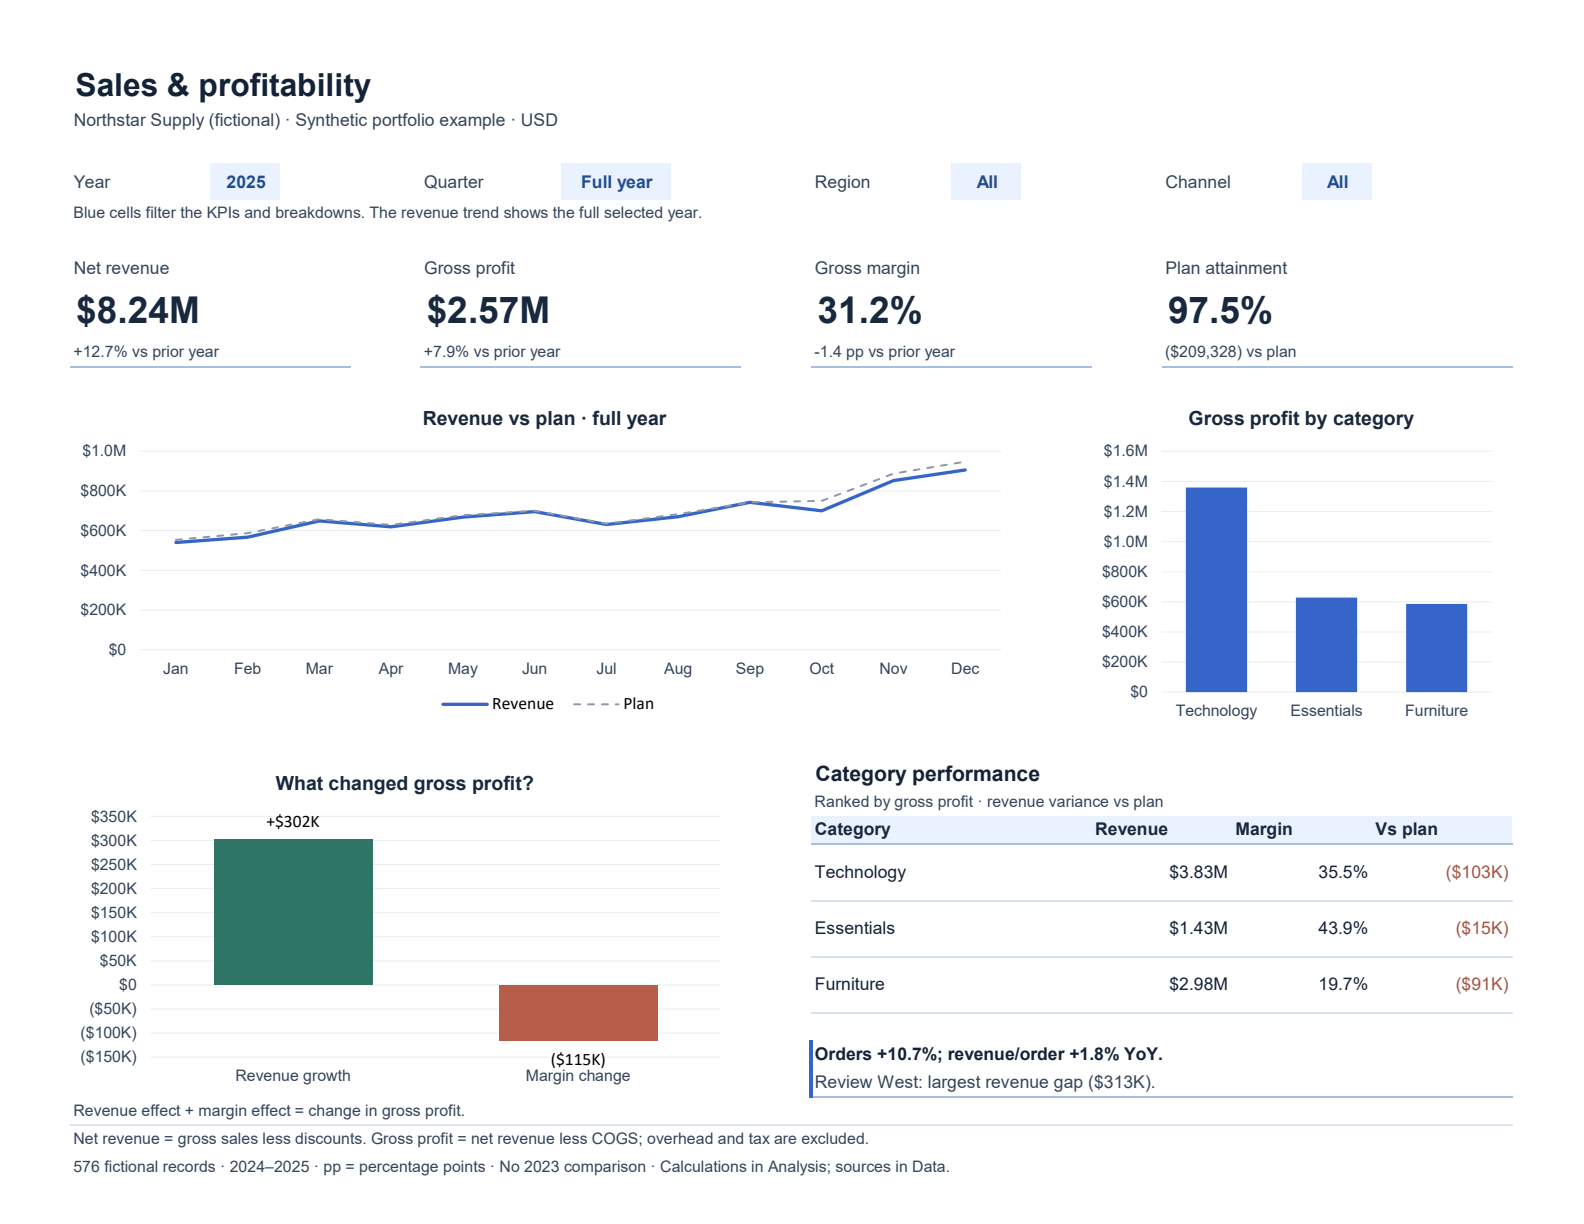
Excel sales and profitability dashboard connected to a SQL investigation
EXCEL + SQL · FICTIONAL DATA

Sales & Profitability

The question
Is sales growth producing stronger profit?
The approach
Reconcile revenue and margin contributions in Excel and SQL.
Explore
A guided dashboard tour, five SQL queries and downloadable project files.
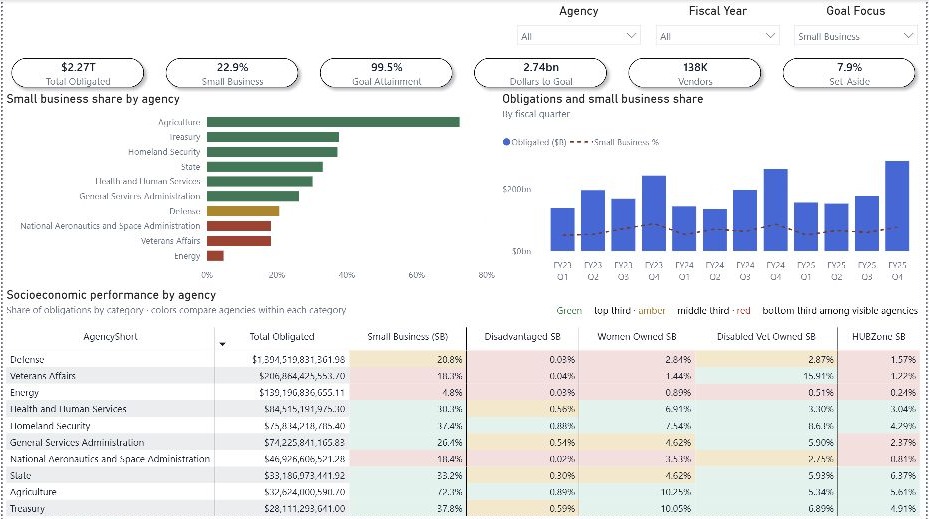
Federal Contracting Performance Power BI dashboard
POWER BI · PUBLIC DATA

Federal Contracting Performance

The question
Where are federal awards concentrated, and how does participation vary?
The approach
Compare agencies and fiscal years, with separate measures for participation and goal attainment.
Explore
The dashboard, data model and validation checks.
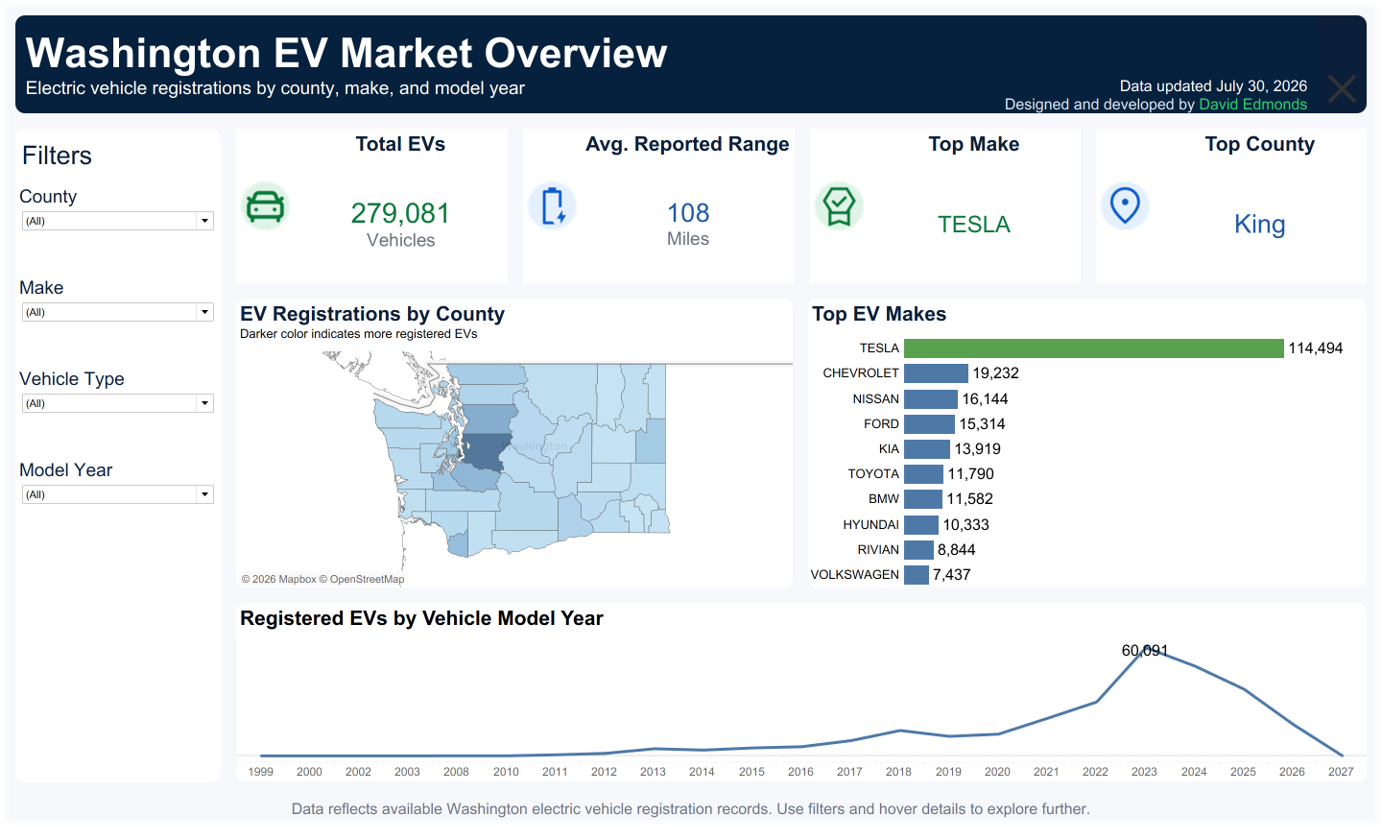
Washington EV Market Overview Tableau dashboard
TABLEAU · PUBLIC DATA

Washington EV Market Overview

The question
How are registered EVs distributed across counties, manufacturers and vehicle types?
The approach
Compare fleet counts and composition, with filters for geographic and vehicle characteristics.
Explore
The interactive Tableau dashboard and the limits of registration data.
Browse all Work →
EXPERIENCE10+ yearsAnalytics, reporting, and decision support
TOOLSPower BI · Tableau · SQLPlus Excel, Python, PostgreSQL, and SharePoint
EDUCATIONB.S. AnalyticsPurdue Global · 2024
INTERACTIVE TOOLS

Try the analysis with your own inputs.

Compare reports, check a CSV, estimate reporting effort or test profit assumptions. Each tool runs in your browser.

Open the analytics lab →
CAREER & CONSULTING

Let’s find the right next step.

Contact me about remote analytics roles or questions about my work. For consulting services and project inquiries, visit Bold Proof Analytics.

Contact David ↗

Explore Bold Proof Analytics ↗