← Back to WorkEXCEL · PROFITABILITY · GROWTH DRIVERS

Growth is only
half the story.

A compact sales dashboard that connects revenue growth to profit, makes margin pressure visible, and points to the next question worth asking.

Independent portfolio example · fictional Northstar Supply data · no client information.

THE QUESTION

Are higher sales translating into stronger profit—and where is performance falling short?

THE APPROACH

Compare matching periods, separate growth and margin effects, and reconcile every contribution to the underlying totals.

THE DELIVERABLE

A one-page Excel dashboard with four filters, three editable charts, supporting calculations and a fictional source table.

KEY FINDINGS

What the evidence tells us.

Fictional Northstar Supply data · full-year 2025 vs 2024 · all regions and channels. These findings describe the sample, not client outcomes.

12.7% vs 7.9%

Revenue outpaces profit

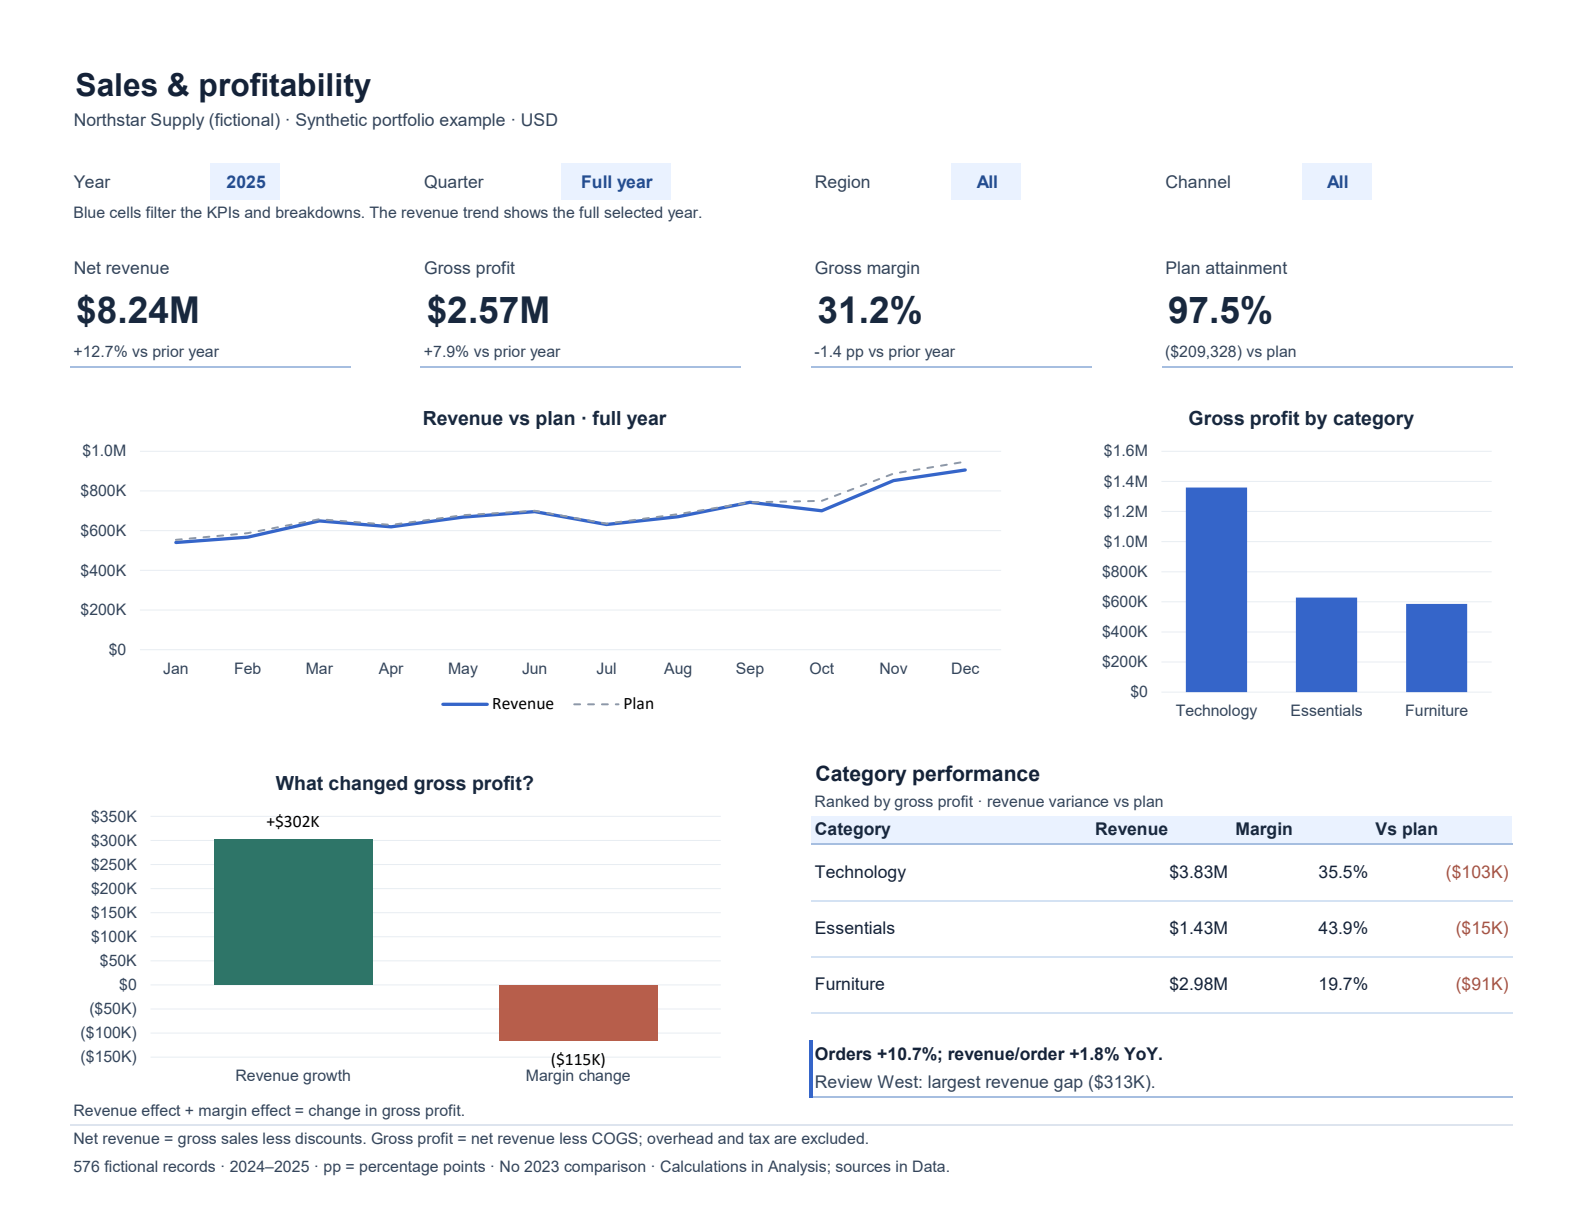
2025 revenue reached $8.24M, up 12.7%. Gross profit reached $2.57M, up 7.9%; margin fell about 1.4 percentage points to 31.2%.

Decision to inform

Review margin alongside sales growth before judging performance.
Annual performance results
−$115K

Margin pressure offsets growth

Revenue growth contributes $302,455.59 to gross profit. The margin effect offsets $115,095.05, leaving a reconciled $187,360.54 increase.

Decision to inform

Investigate pricing, discounts, costs and mix. This decomposition does not identify the business cause.

Reconciled profit contributions
$313K below plan

Start the regional review in West

West reaches 88.3% of its annual revenue plan, a $312,710.96 shortfall—the largest regional gap in the sample.

Decision to inform

Check West’s plan assumptions and segment performance before choosing an intervention.

Regional plan results
WORKBOOK PREVIEW

See the story at a glance.

This is the default 2025 view. Download the workbook to change year, quarter, region and channel in Excel.

2025 fictional sample: $8.24M net revenue, $2.57M gross profit, 31.2% margin, 97.5% plan attainment; revenue growth adds $302K in profit while lower margins offset $115K.
72-SECOND DASHBOARD DEMO

See how to read the result.

A captioned video using actual workbook views: start with the question, narrow the filters, then inspect the profit drivers. No audio; all explanations appear on screen.

ONE-MINUTE GUIDED TOUR

From a number
to a useful question.

Three short steps using actual workbook views. These are guided previews; download the project to operate the filters in Excel.

2025 · Full year · All regions · All channels

Sales grew faster than profit.

Revenue is up 12.7%, while gross profit is up 7.9%. The 1.4 percentage-point margin decline explains why growth alone does not tell the whole story.

In Excel: start with the four headline metrics, then compare their changes against the prior year.

Step 1 of 3
Full-year Excel view with $8.24M revenue and $2.57M gross profit
TRANSPARENT BY DESIGN

Useful detail, visible limits.

Trace the answer

Dashboard shows the results; Analysis contains the formulas and driver checks; Data holds 576 fictional monthly records for 2024–2025. Gross profit excludes overhead, interest and tax.

Compare like with like

Prior-year comparisons use matching months and filters. There is no 2023 data, so 2024 comparisons are unavailable. The revenue trend retains full-year context when a quarter is selected.

Open and explore

Verified in desktop Excel, including filters, recalculation and reconciliation. No macros or external connections. The guide explains the fixed source ranges and how to extend them.

APPLY THIS TO YOUR TEAM

Need a clearer view of sales and profit?

Discuss a dashboard that connects your revenue, margins and performance questions.