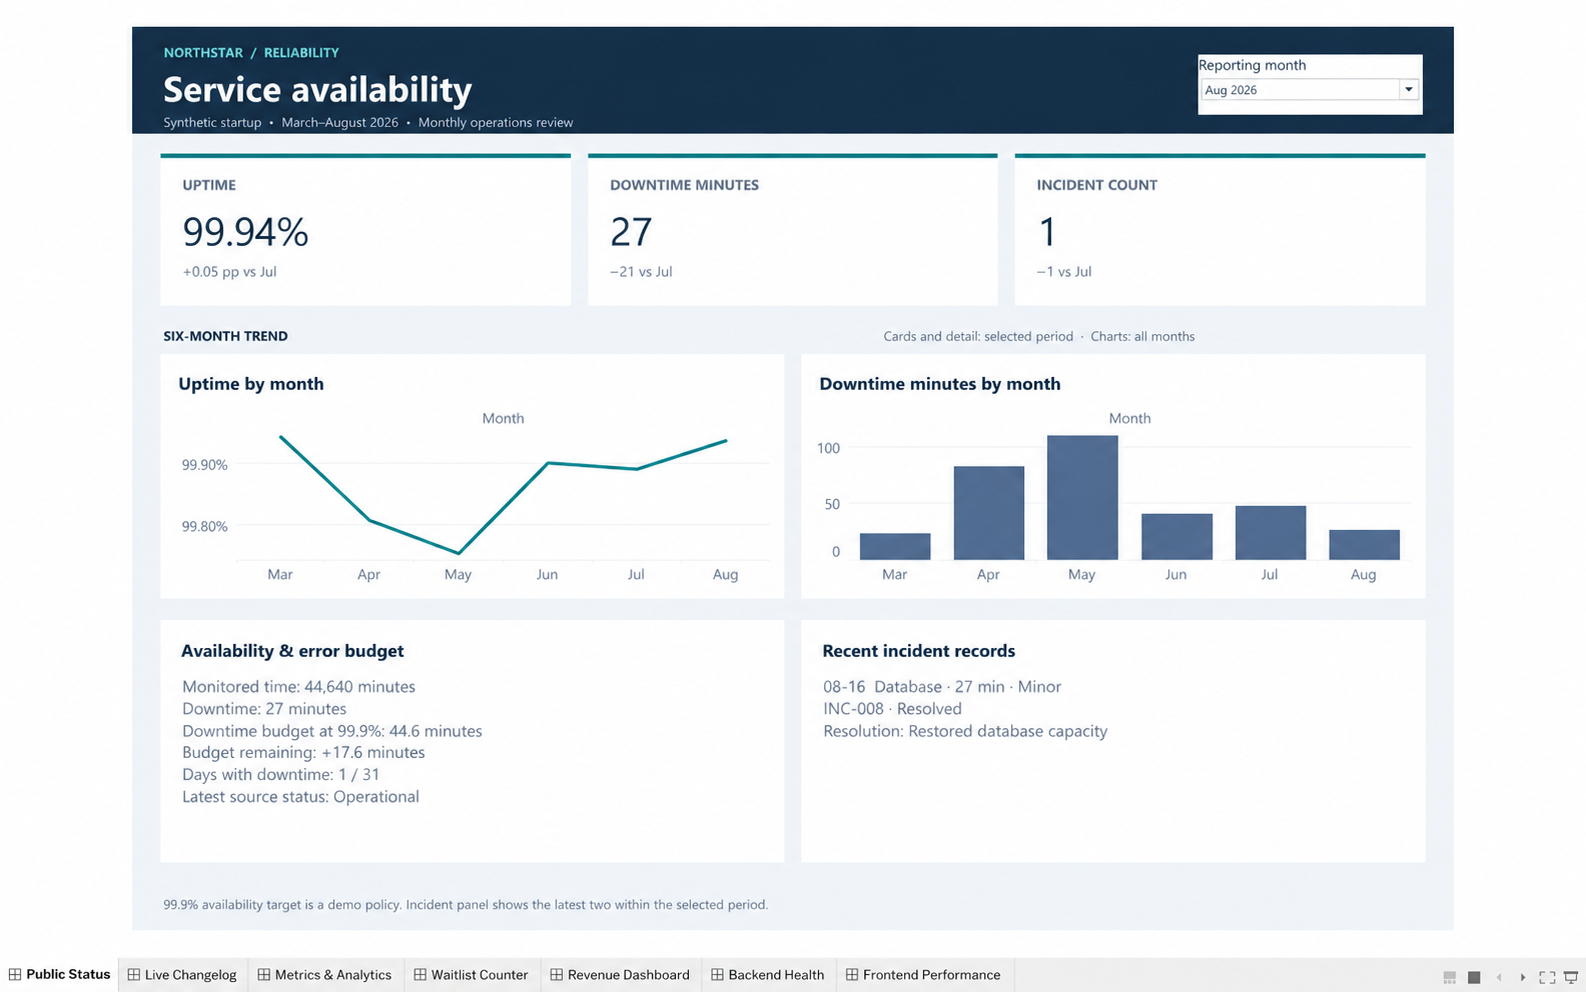
Public Status
Is service availability within the demo target?
Weighted uptime, downtime budget and incident detail connect the headline rate to affected services, severity and resolution.
A monthly operating review for a fictional startup: measure service health, understand product and acquisition activity, and reconcile changes in recurring revenue.
Editable packaged workbook with both data extracts included. The previews below are static screenshots captured in Tableau, with cursor cleanup for presentation; interactive controls are available in the downloaded workbook.
What changed this month, what explains it, and which operational signals deserve attention?
21 headline metrics with comparisons, 14 trend charts and 14 detail panels, using a shared reporting-month selector.
184 daily records, 26 releases and eight resolved incidents. All data is fictional, covering March–August 2026.
Each view moves from headline performance to trends and supporting detail. These screenshots show August 2026.
Is service availability within the demo target?
Weighted uptime, downtime budget and incident detail connect the headline rate to affected services, severity and resolution.
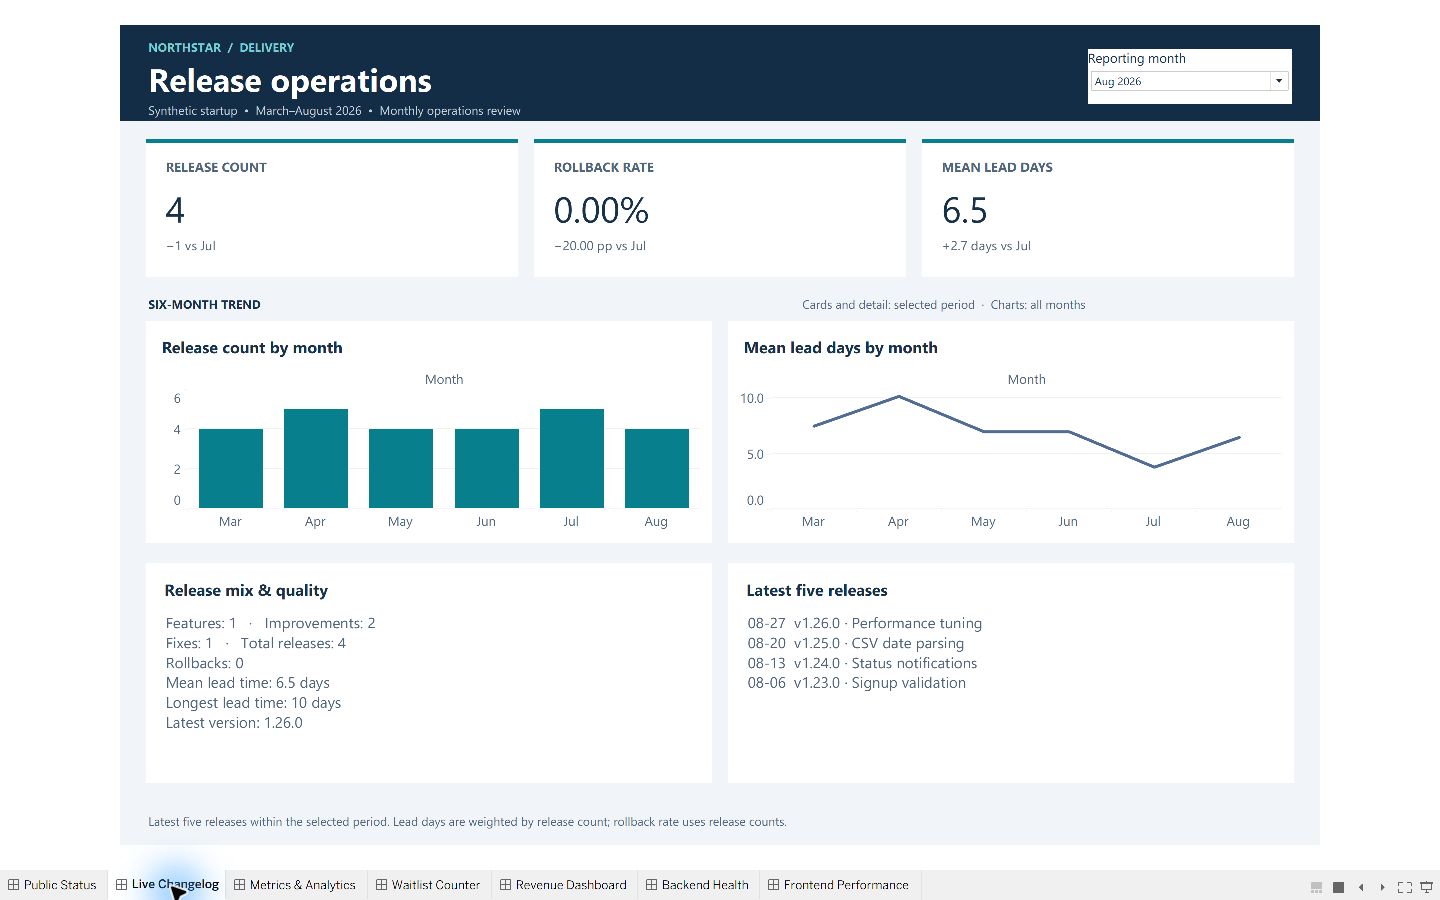
What shipped, and how reliably?
Release volume, rollback rate and lead time sit alongside the feature mix and recent release history.
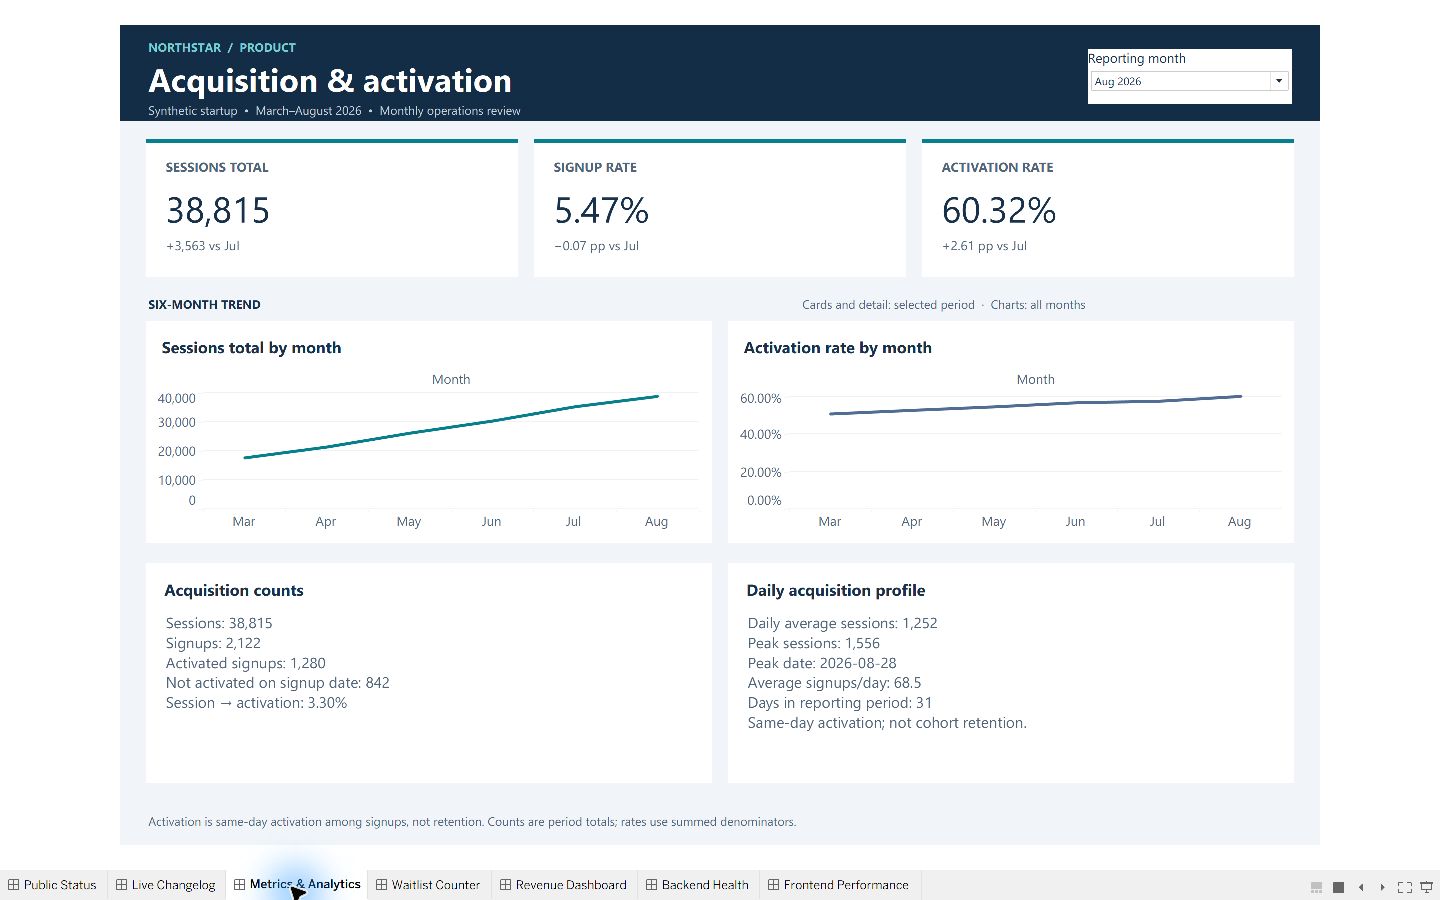
Where does acquisition turn into activation?
Sessions, sign-ups and same-day activations make conversion denominators visible, with daily volume context.
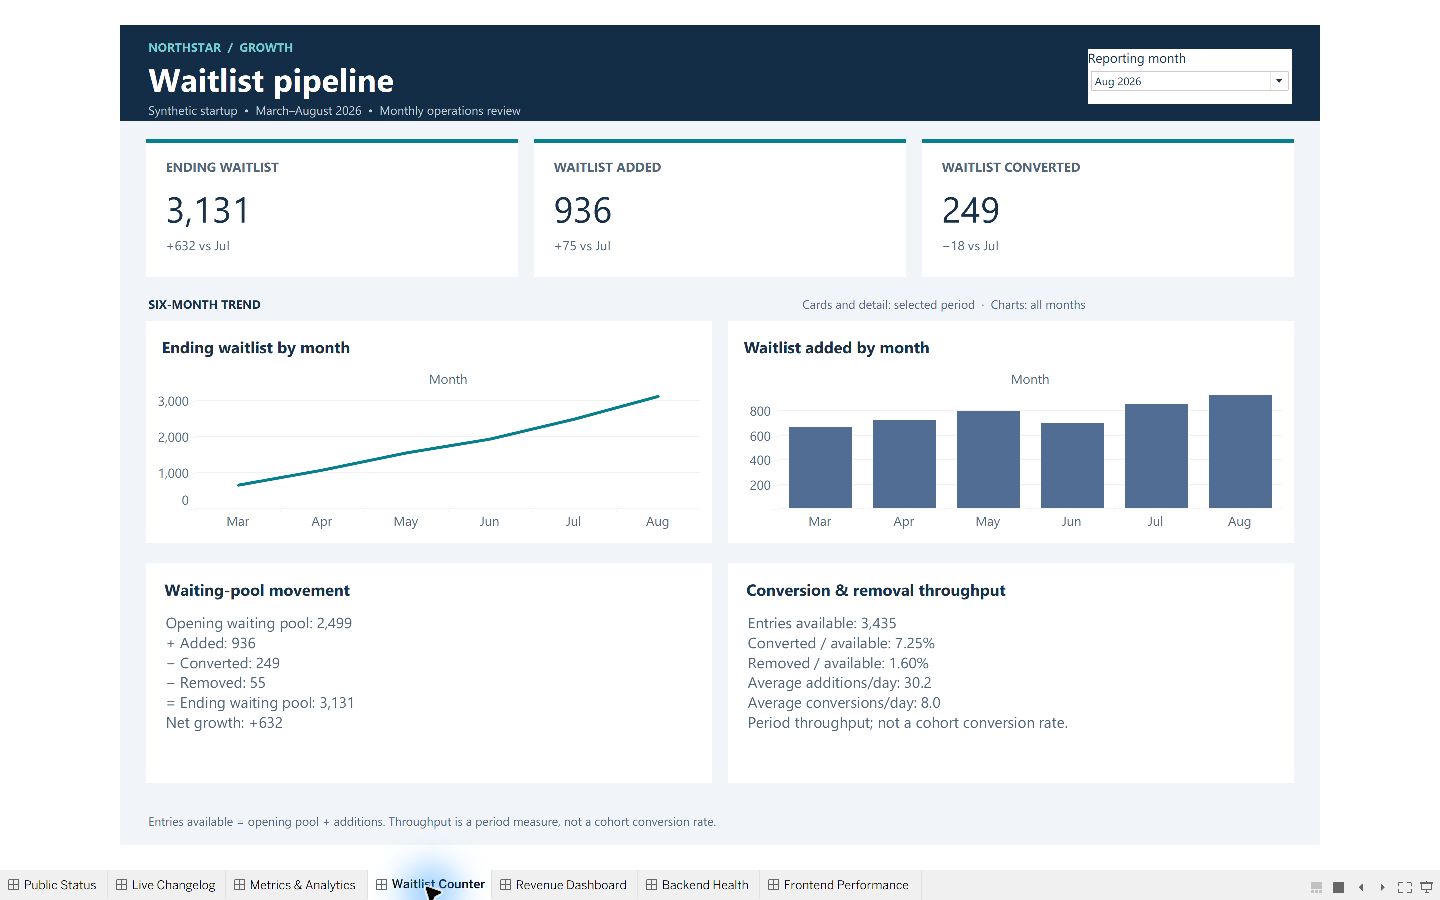
What explains the change in the waiting pool?
Opening balance plus additions, less conversions and removals, reconciles to the closing balance. Throughput is not cohort conversion.
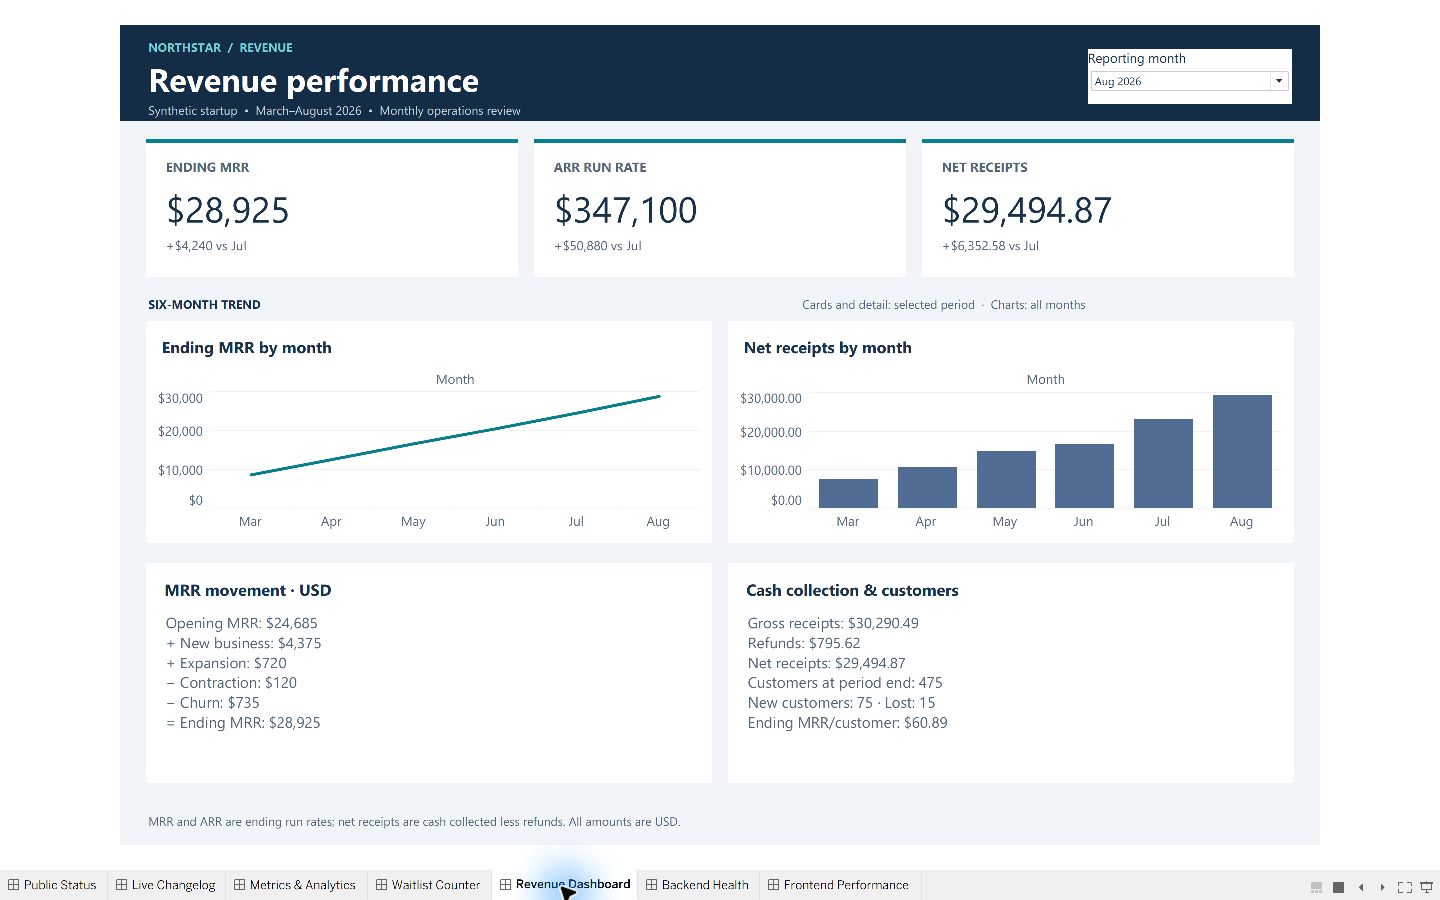
What moved recurring revenue?
New MRR, expansion, contraction and churn reconcile the opening and closing run rates. Cash receipts, refunds and customer counts provide supporting context.
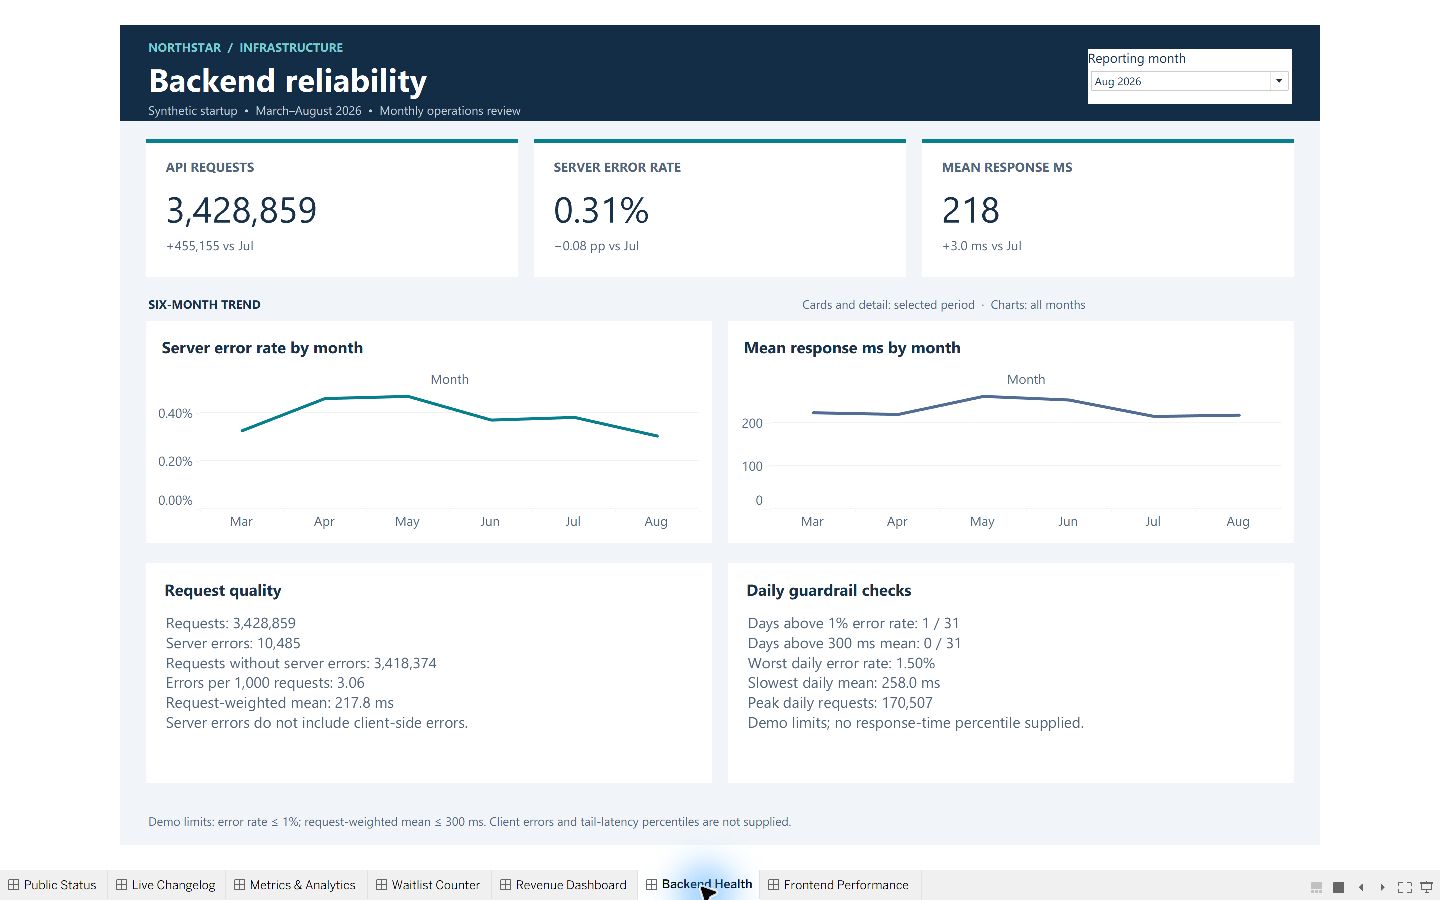
Which reliability issues need investigation?
Request-weighted response time, error counts and daily demo-threshold breaches identify periods to investigate.
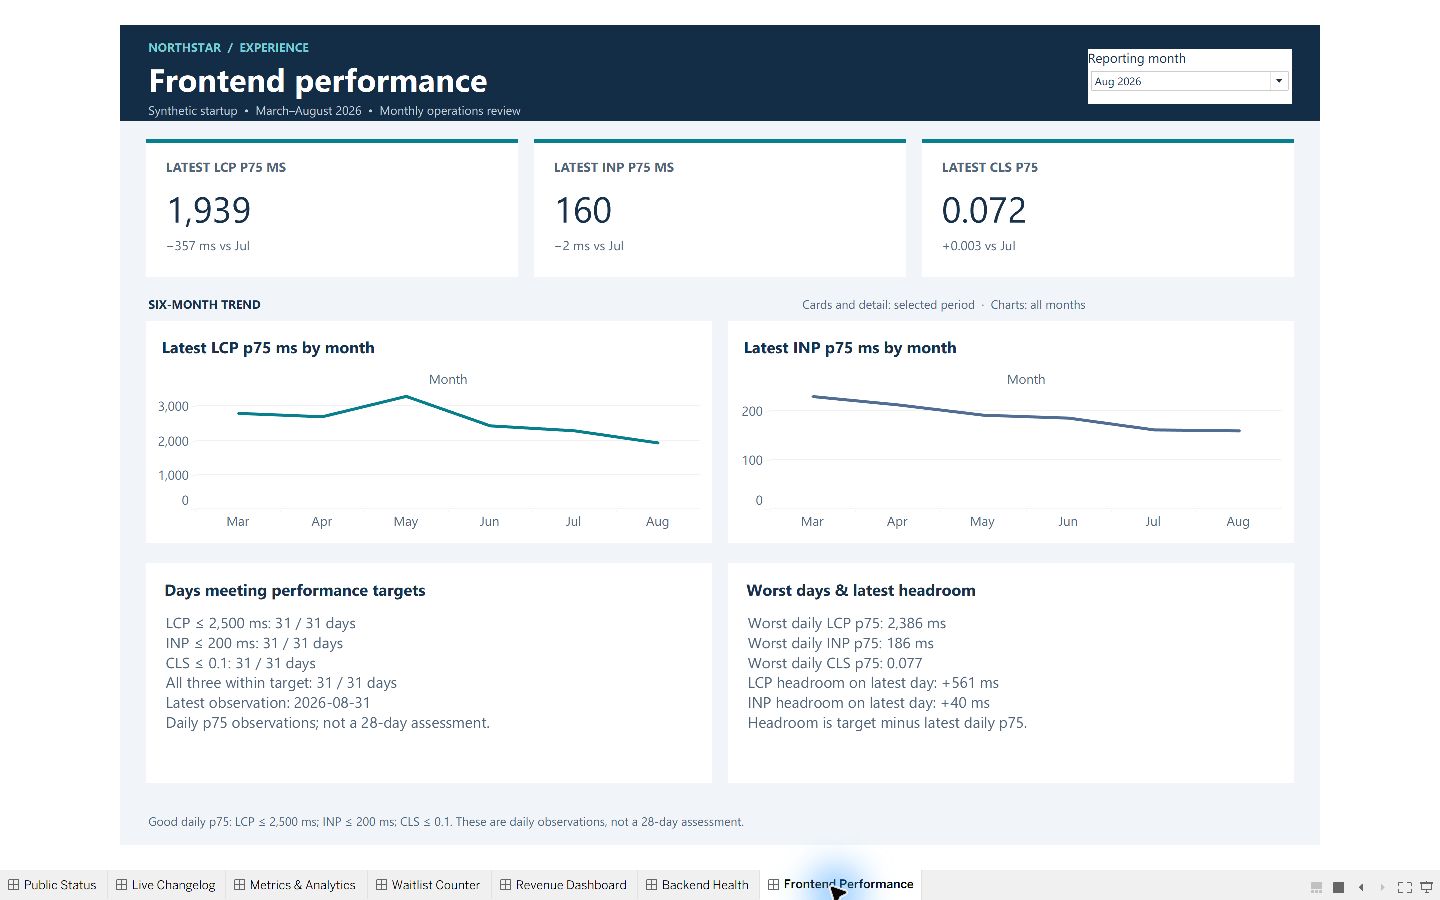
How consistently does the experience meet the demo targets?
Daily p75 LCP, INP and CLS observations, target attainment days and worst observations reveal performance variation.
Opening-to-ending MRR and waitlist movements balance. Ending balances are not summed across days; rates divide aggregated counts. Monthly headline reconciliation checked 126 sample values.
MRR is a recurring run rate; receipts are cash collection. Waitlist throughput is not cohort conversion. Frontend metrics are daily p75 observations, not monthly percentiles or a 28-day Core Web Vitals assessment.
Rates use percentage-point changes. March has no prior-month baseline in the sample. Full-period views distinguish period totals from ending observations.
All seven dashboards were inspected in Tableau. This is a demonstration template, with no live feeds, automatic refresh or alerts. Supporting detail is precomputed: changing production data requires rebuilding both extracts together and reconciling the results. The download does not include the refresh toolkit, and real-data replacement has not been validated.